


�$B Speaker Feature and Long
�$B>e$X�(B: Unknown-Multiple Signal Source Clustering
�$BLa$k�(B: Evaluation Method of Speaker
Fig.4 shows the result of experiment, where the
LPC cepstrum is calculated with the window length is 21.3ms. The average
classification rate is given by the average for 8 sets of speech data
for experiments 1 and 2. In experiment 3, 16 different
initial models were tried for each of the 8 sets of speech
samples. Therefore, the rate is the average of 128 trials.
�$B?^�(B 4:
Relationship between number of iterations and classification rate
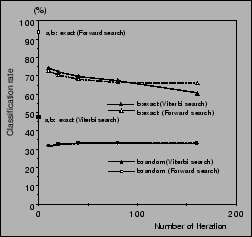 |
The following observations can be obtained from this figure.
- The average speaker classification rates of the
Viterbi and the forward algorithm differ little. However,
in experiment1 , ( true values are given to all parameters),
forward decoding gives 94.0 %, while Viterbi decoding gives only
48.3 %.
- In experiment 2 (the true value is given only to the symbol
output probability
 ), the average classification rate is
about 75%. However, the average classification rate decreases
with training.
), the average classification rate is
about 75%. However, the average classification rate decreases
with training.
- In experiment 3 (
is set at random ), the average
classification rate is low, being 30% to 35%. This value is not improved
even if the amount of training is increased.
The reason seems to be as follows. In this experiment, the LPC analysis
condition is the same as used for speech recognition [2]. Thus the parameters have a phoneme feature, but not a speaker feature.
Subsections
�$B Speaker Feature and Long
�$B>e$X�(B: Unknown-Multiple Signal Source Clustering
�$BLa$k�(B: Evaluation Method of Speaker
Jin'ichi Murakami
�$BJ?@.�(B13�$BG/�(B1�$B7n�(B19�$BF|�(B